
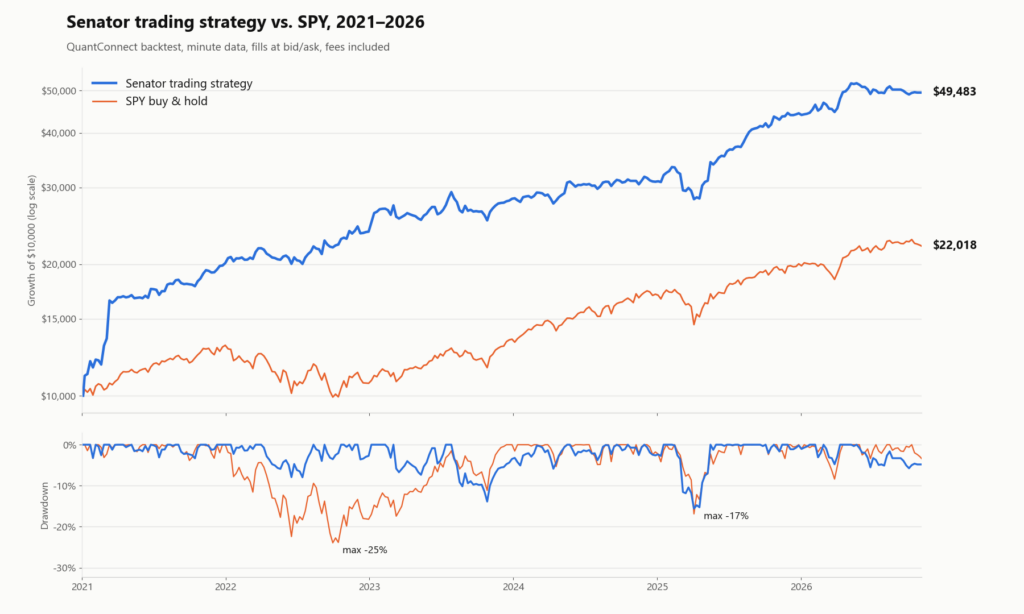
| 2021 – 2026 | Strategy | SPY buy & hold |
|---|---|---|
| Annual return (CAGR) | 31.6% | 14.5% |
| Maximum drawdown | −17.3% | −24.5% |
| Return / max drawdown (MAR) | 1.82 | 0.59 |
| Sharpe ratio | 1.84 | 0.90 |
| 2022 | +18% | −18% |
| Worst calendar year | +9% | −18% |
| $10,000 became | $49,483 | $22,018 |
The idea
Members of the US Congress have to disclose their stock trades. Since the STOCK Act of 2012, every purchase and sale has to be reported within 45 days, and the reports are public. A popular claim followed quickly: politicians beat the market, so just copy them.
There are newsletters, apps and even ETFs built around this idea. I wanted to know whether it holds up when you test it honestly.
So I asked a simple question: if you buy what US Senators report buying and hold it for about a month, do you beat the market?
How the strategy works
The rules are deliberately simple:
- Every day, read the new disclosures and keep only Senate purchases. Sales and House trades are ignored.
- Only US common stocks qualify. Foreign ADRs and real estate trusts are left out.
- Buy a stock when a fresh purchase report comes in, and only if that report is a few days old at most.
- Hold it as long as a Senator reported buying it within the last 30 days. Once the latest report is older than that, sell.
- Hold at most 20 stocks. With a full portfolio each one gets 5%. When only a few stocks qualify, each gets at most 10% and the rest stays in cash. The strategy never borrows money.
- Positions are not trimmed in between. Winners are allowed to run.
There is no forecasting, no indicator and no optimisation. The Senators pick the stocks. The strategy only decides when to get in and when to get out.
Why I use minute data
Most simple backtests use daily data. They assume you buy and sell at the day’s opening or closing price. That price is a single number, and in practice nobody trades exactly at it: you buy at the ask, you sell at the bid, and the gap between the two is a cost on every trade.
Minute data includes those bid and ask quotes. The strategy places its orders a few minutes after the market opens, and the backtest fills every buy at the ask and every sell at the bid at that moment. That is much closer to what a real account would get.
For this strategy the difference turned out to be small, because it mostly buys large, liquid companies. The spread cost well under half a percent a year. I still prefer to measure that rather than assume it.
Minute data has one limit. It shows the price you could trade at, not how much a large order moves that price. With a big account, buying a full position in one go shortly after the open would cost more than the backtest shows.
Why it can work
1. Senators sit close to the information.
They sit on committees, receive briefings and write the laws that decide which industries get contracts, subsidies or new regulation. Even without breaking any rule, it is plausible that this gives them a better feel for where certain companies are heading.
2. Purchases say more than sales.
People sell for many reasons: taxes, a house, a divorce, rebalancing. They buy for one: they expect the stock to go up. That is why the strategy only follows purchases.
3. The signal is free.
The data is public, the rules fit on a napkin, and you don’t need a model to predict anything. Other people’s conviction does the stock picking for you.
4. Only fresh ideas count.
Holding a stock only while there is a recent purchase report keeps the portfolio moving toward the newest ideas and drops the stale ones automatically.
What I found
For the last few years, the results look excellent. From 2021 to 2026 the strategy beat the S&P 500 by a wide margin, with smaller drawdowns, even though it often held a lot of cash.
On its own, that proves little. Senators like to buy large, well-known companies, and large companies did very well in those years. So I ran a control test: same timing, same position sizes, but every Senate pick replaced by a random stock of similar size. The advantage almost completely disappeared. In this period, the actual picks mattered.
One trade deserves a mention. In early 2021 a Senator reported a small GameStop purchase just before the second meme-stock spike. That single position added close to 40% to the portfolio within a month. That is luck, not skill. But even without 2021, the strategy still earned about 20% a year against about 11% for the index.
Then I ran exactly the same rules on 2015 to 2020, and the picture flipped.
That is the most important result of the whole test: the strategy worked very well in one period and not at all in the other.
2015 to 2020: why it didn’t work
Here are the same rules over the six years before. Nothing changed except the period.
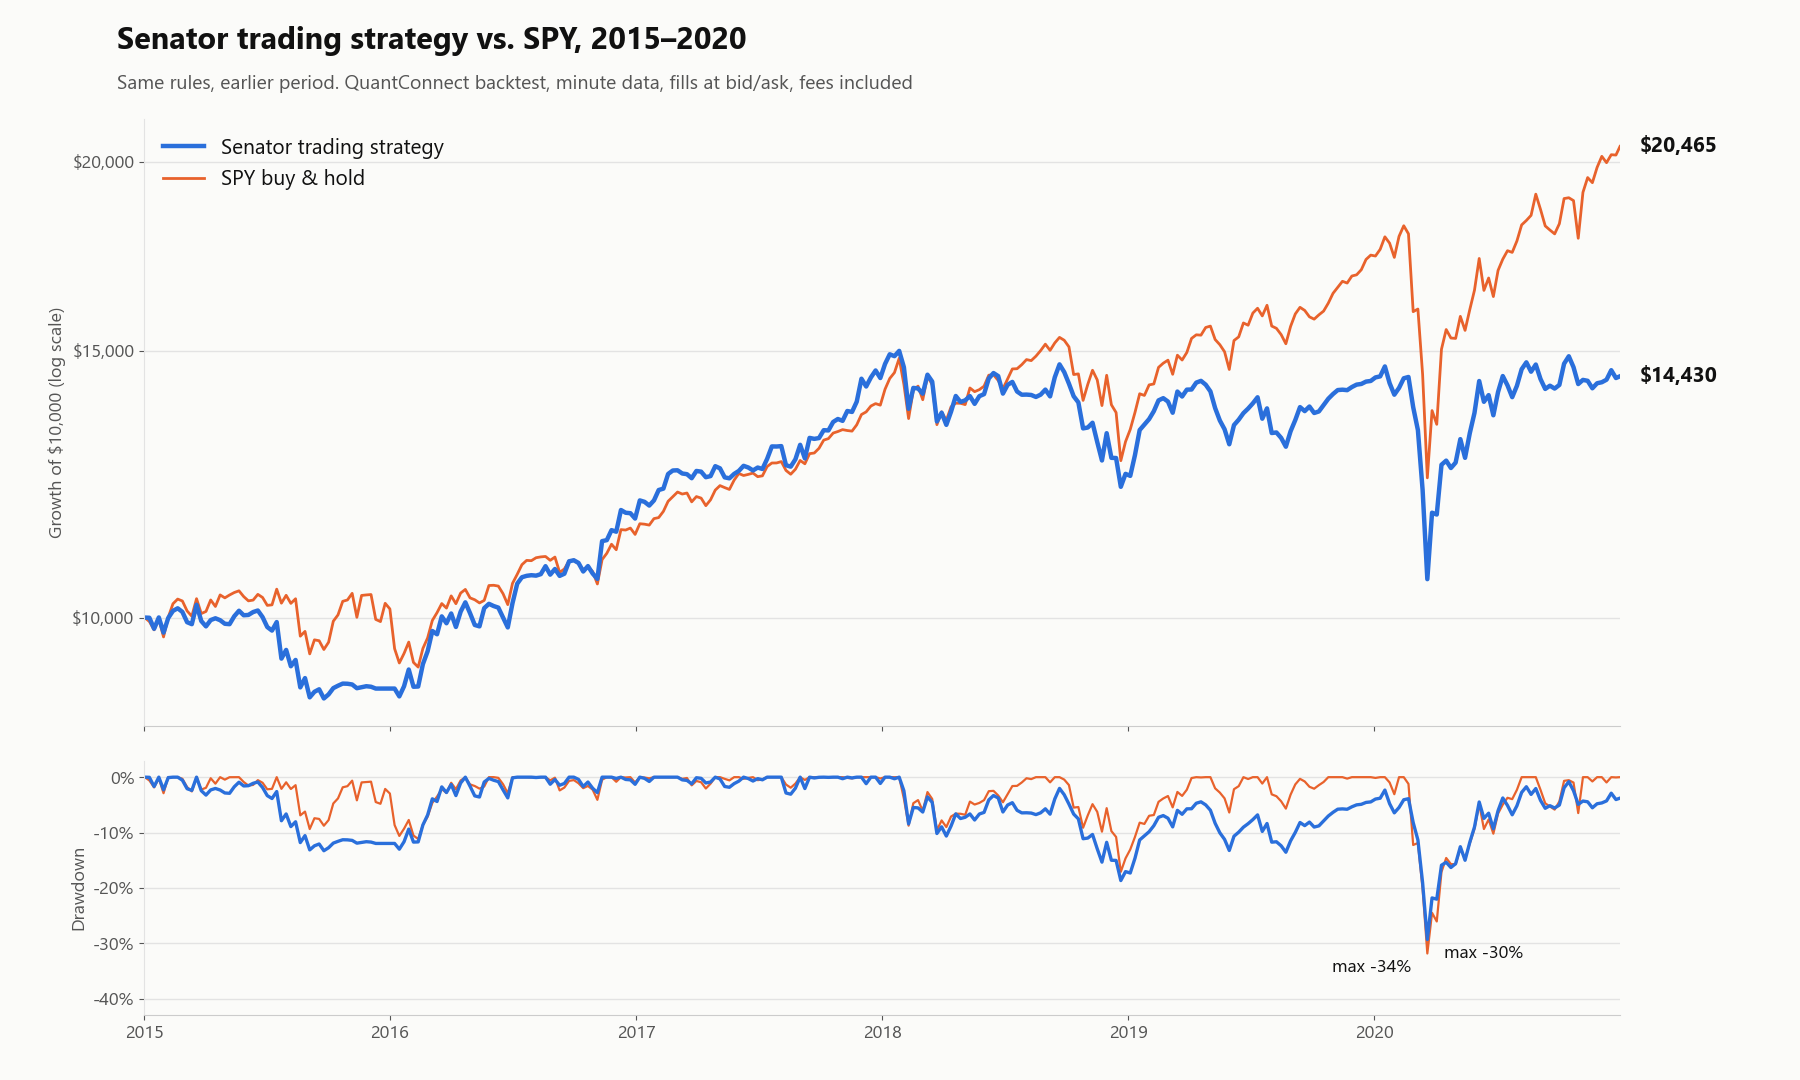
| 2015 – 2020 | Strategy | SPY buy & hold |
|---|---|---|
| Annual return (CAGR) | 6.3% | 12.7% |
| Maximum drawdown | −30.3% | −33.7% |
| Return / max drawdown (MAR) | 0.21 | 0.38 |
| Sharpe ratio | 0.45 | 0.74 |
| 2015 | −10% | +1% |
| 2018 | −13% | −5% |
| 2020 | +1% | +18% |
| $10,000 became | $14,430 | $20,465 |
1. The portfolio was nearly always full.
Senators traded far more back then. Most of the time the strategy was close to fully invested in a broad mix of whatever they happened to buy: banks, industrials, defense companies, airlines and some tech. A portfolio like that behaves like the market, minus trading costs.
2. There was no theme to ride.
From 2021 on, large tech stocks carried the market and Senators happened to own many of them. Between 2015 and 2020 their purchases were spread across many sectors, and on balance those stocks did worse than the index.
3. The losing years cost too much.
The strategy lost money in 2015 and 2018 while the index was flat or only slightly down. And after the 2020 crash the index recovered within months, while the strategy ended the year roughly where it started.
Put together, the strategy earned about half of what the index did, with similar drawdowns. Same rules, same kind of data, no edge.
Why it fails
1. The information is old.
Senators have up to 45 days to report a trade, and many use most of that time. By the time you can act, the trade is often one to three months old. Whatever the Senator knew may already be in the price.
2. A few people make most of the trades.
In any given year, a handful of very active Senators dominate the data. When one of them leaves office or simply stops trading, the strategy changes character overnight. You are not following the Senate, you are following a few individuals.
3. Skill and luck are hard to separate.
In recent years Senators bought a lot of large tech stocks, exactly the sector that went up the most. My control test matched company size, but not sector. Part of the good result may simply be a lucky tilt, not insight.
4. The signal is noisy.
Disclosures only show a value range, so a $1,000 purchase counts the same as one of $50,000 or more. Some trades are made by spouses or by advisers who manage the account, so the Senator may not have made the decision at all.
5. Sometimes there is nothing to buy.
Around elections and holidays, few trades get reported. The portfolio then sits mostly in cash and misses rallies it has no opinion on.
6. The data source could disappear.
A ban on stock trading by members of Congress keeps coming up in Washington. If it ever passes, the strategy loses its only input.
My take
Senator trading is a great story, and in recent years it was also a good strategy. But it is not a reliable edge. It did not work in the years before, and the reasons it worked recently, a few very active traders and a strong run in large tech, are exactly the kind of things that don’t last.
The cost: you can follow these rules for years and earn less than an index fund, with no way to tell in advance which kind of period you are in. If you want to use the idea, treat it as a small satellite next to a diversified core, not as the core itself.
Download the code
The complete QuantConnect code for this strategy is free. It contains every rule described above and the settings used for this article, so you can run the backtests yourself and change whatever you like. Expect small differences depending on data and settings.
You need the Quiver Quantitative US Congress Trading Universe on QuantConnect to run the backtest.
To receive the download link, just subscribe here:
Get the next strategy by email
New strategies with every rule, backtest and metric – straight to your inbox.
Free. Unsubscribe anytime.
This article is for educational purposes only and is not investment advice. Backtested results are hypothetical, do not reflect actual trading, and do not guarantee future performance.