
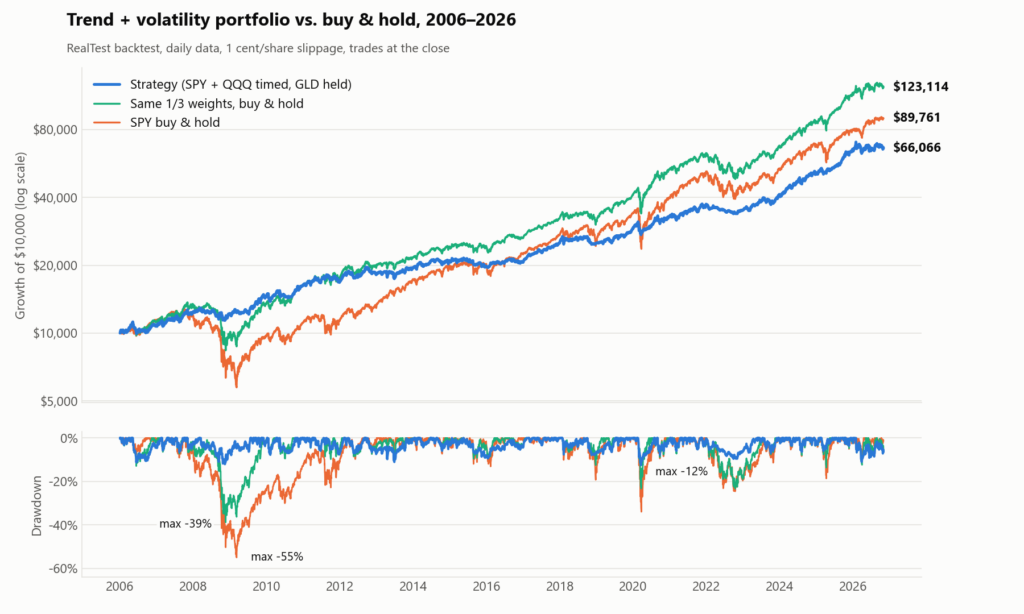
| 2006 – 2026 | Strategy | Same 1/3 weights, buy & hold | SPY buy & hold |
|---|---|---|---|
| Annual return (CAGR) | 9.5% | 12.8% | 11.1% |
| Maximum drawdown | −12.5% | −38.8% | −55.0% |
| Return / max drawdown (MAR) | 0.76 | 0.33 | 0.20 |
| Sharpe ratio | 0.98 | 0.88 | 0.65 |
| 2008 | −1% | −26% | −36% |
| 2022 | −6% | −17% | −18% |
| Worst calendar year | −6% | −26% | −36% |
| $10,000 became | $66,066 | $123,114 | $89,761 |
The question that started it
Most of us already know the „right“ answer: buy an index fund and never sell. Over 20 years, SPY turned $10,000 into almost $90,000.
The problem is what happens in between. To earn that return you had to sit through a 55% loss in 2008 without selling, then 34% in five weeks in 2020, and 25% again in 2022. Very few people actually do. They sell near the bottom and buy back after the recovery, and their real return ends up far below the index’s.
So I asked a different question: how much of the market’s return can you keep if you refuse to ever lose more than a modest amount?
I started from a simple SPY strategy, an EMA-based trend filter I’d been using, and gave it a proper stress test: about 400 backtests, walk-forward validation, transfer tests on other ETFs, and a portfolio built from the pieces that survived. Most ideas failed, some of them popular ones. Two simple building blocks survived every test I threw at them.
The result is the portfolio above. Its worst drawdown in 20 years was 12.5%, it lost 1% in 2008, and its worst calendar year was −6%. It still compounded at 9.5% a year.
Why this is attractive for preserving capital
1. Losses are asymmetric, so avoiding them matters more than chasing gains.
A 55% loss needs a 122% gain to get back to even. A 12.5% loss needs 14%. After 2008, SPY took until 2012 just to recover. The strategy was back at new highs by mid-2009.
2. You still take part in rising markets.
This is not a market-timing system that sits in cash for years. On average about 78% of the capital is invested, and in calm, rising markets the stock part is fully invested. Positions shrink when markets get turbulent and go to cash only when the long-term trend breaks.
3. Three return sources, not one.
The portfolio combines the broad US market, the large-cap tech segment and gold. Gold has often held up or risen exactly when stocks were in trouble. The two stock parts each use their own trend signal, so a single false signal never moves the whole portfolio.
4. A strategy you can actually stick with.
The best strategy is the one you still follow in year three. With a worst year of −6%, there is little temptation to abandon the plan at the worst possible moment.
5. Simple, and tested honestly.
It has four rules, uses daily data, trades three liquid ETFs and needs a decision once a day at most. The parameters were checked with walk-forward analysis, which picks settings using only data available at the time. I also tested on ETFs the rules were never fitted to, and I report the variants that failed.
The cost: over this period, holding the same three ETFs without any timing earned more, 12.8% against 9.5% a year. This strategy is for people who value a smooth ride and staying invested over squeezing out the last percent. If you can genuinely sit through a 40–55% loss without flinching, buy & hold may serve you better.
PREMIUM SECTION – the full research, the exact rules and the source code.
This part is for paying readers
Buy lifetime access to the full post. After payment you will receive a sign-in link by email.
Already bought this post? Sign in
Each RealTest file includes its own data import section. Expect small differences on QuantConnect, which uses different price data, dividend adjustment and its default fee model.
This article is for educational purposes only and is not investment advice. Backtested results are hypothetical, do not reflect actual trading, and do not guarantee future performance.